Measuring tractor performance involves a systematic evaluation of multiple factors that affect efficiency, productivity, and overall return on investment. Accurate assessment enables farmers, contractors, and equipment managers to select the most suitable machines, optimize field operations, and reduce operational costs. This article explores the key metrics and testing methods used to gauge tractor capability across different applications, from heavy tillage to precision planting.
Engine Efficiency and Power Output
The heart of any tractor is its engine, which delivers horsepower and torque to perform demanding tasks. Understanding engine performance requires both laboratory bench tests and field measurements.
Gross vs. Net Power
Gross power describes the output measured at the engine flywheel without auxiliary losses. Net power accounts for power consumed by cooling systems, alternators, and hydraulic pumps. Manufacturers often publish both values:
- Gross Power – Maximum potential energy available
- Net Power – Real-world usable output under working conditions
Torque Curve Analysis
Plotting engine torque against engine speed (rpm) reveals an optimal operating range. A flat torque curve indicates consistent pulling capability across a wide rpm band. Performance testers use dynamometers to record:
- Peak torque
- Torque rise percentage
- Decline after maximum torque
Tractors with high torque rise maintain traction when encountering heavier loads, minimizing slippage and fuel waste.
Fuel Consumption and Economy
Fuel expense can represent 20–30 percent of total operating costs. Evaluating fuel efficiency ensures budget control and environmental responsibility.
Measuring Fuel Flow
On-board flow meters record fuel consumption in liters per hour (l/h) or gallons per hour (gph). For accurate data:
- Calibrate meters before each test
- Conduct measurements at varying engine loads
- Calculate specific fuel consumption (SFC) in g/kWh or g/hp·h
Field Fuel Economy Tests
Real-world economy tests involve running tractors through standardized tasks—plowing, harrowing, planting—while tracking fuel use per hectare or acre. Data analysis highlights:
- Fuel per work unit (L/ha or gal/ac)
- Comparison across implement types
- Variations due to soil conditions and terrain
Optimizing engine mapping, tire selection, and travel speeds can substantially improve cost-effectiveness.
Traction, Drawbar Pull, and Field Performance
The ability to transfer engine power to the ground determines productivity in tillage, seeding, and hauling operations. Key metrics include drawbar pull and slip ratio.
Slip Measurement
Excessive wheel slip wastes energy and increases soil compaction. Slip ratio is calculated by comparing theoretical travel speed to actual speed:
- Attach a dynamometer sled to the drawbar
- Measure pull force and forward speed
- Record wheel rpm and calculate slip percentage
Drawbar Power vs. PTO Power
Drawbar tests involve heavy implements, while Power Take-Off (PTO) tests measure power delivered to driven attachments like mowers and balers. Typical procedures:
- Run drawbar tests at various throttle settings
- Use PTO dynamometers to record power at 540 or 1000 rpm
- Compare results to engine flywheel ratings
High-performance tractors exhibit minimal power loss between engine and wheels or PTO shaft.
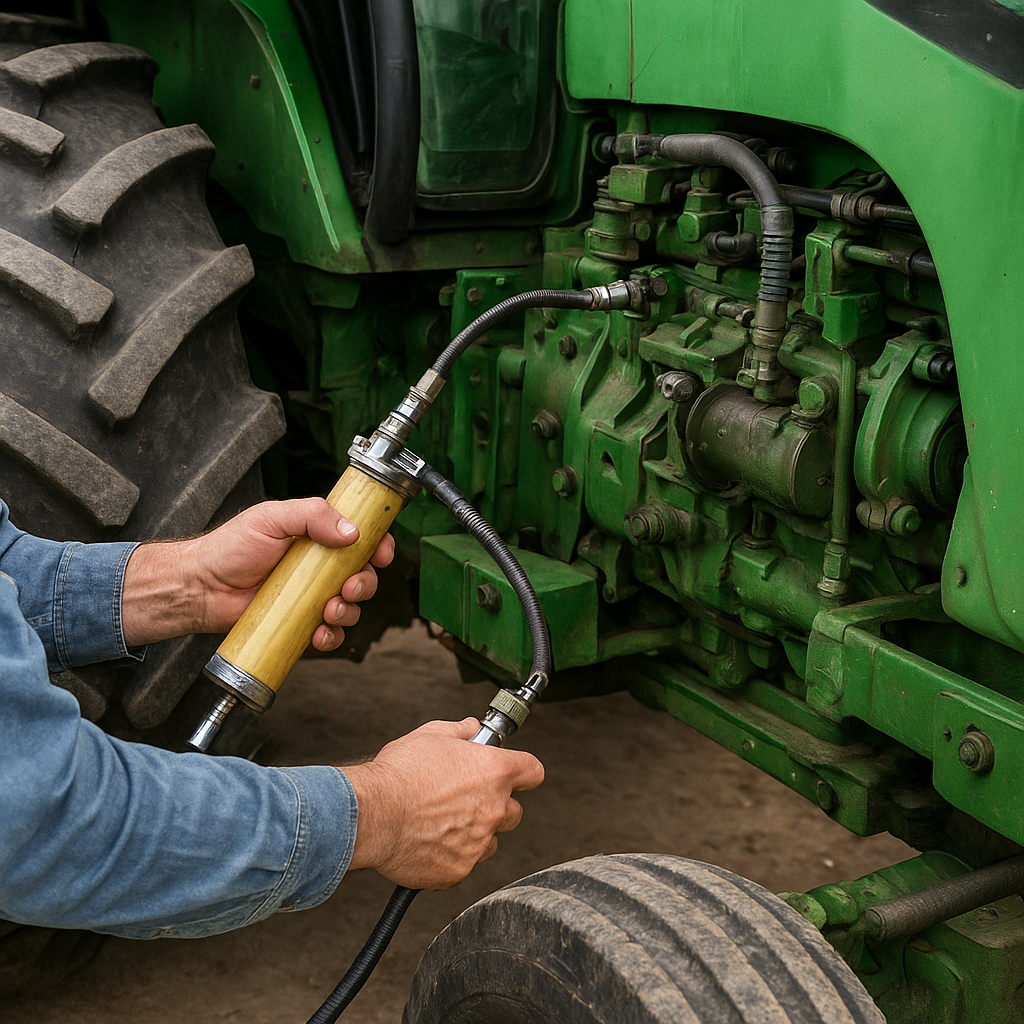
Hydraulic Performance and Implement Control
Modern tractors rely on sophisticated hydraulic systems to operate loaders, rear implements, and front attachments. Evaluating hydraulic capacity and response time is essential for demanding tasks.
Flow Rate and Pressure Testing
Hydraulic pumps are rated in liters per minute (L/min) or gallons per minute (GPM) at specified pressures. Measurement requires:
- Flow meters installed in supply lines
- Pressure gauges at control valves
- Tests under no-load and full-load conditions
Circuit Response and Control Precision
Quick hydraulic response improves implement positioning and reduces cycle times. Key indicators include:
- Actuator speed under standard oil temperature
- Joystick sensitivity and return-to-center accuracy
- Electronic control unit (ECU) diagnostics
Operator Comfort, Ergonomics, and Safety Features
High productivity often correlates with operator comfort and low fatigue. Evaluating cab environment and controls can reveal hidden performance advantages.
- Seat Suspension – Vibration isolation and adjustability
- Cab Insulation – Sound levels below 75 dB(A) for long shifts
- Climate Control – Effective heating and air conditioning
- Visibility – Unobstructed sightlines to implements
- Control Layout – Logical grouping and minimal reach distances
Safety systems, such as rollover protection structures and automatic shutoffs, further enhance overall performance by reducing downtime due to accidents.
Maintenance, Durability, and Lifecycle Costs
A tractor’s long-term value depends on durability, ease of service, and total cost of ownership. Monitoring maintenance intervals and wear indicators is critical.
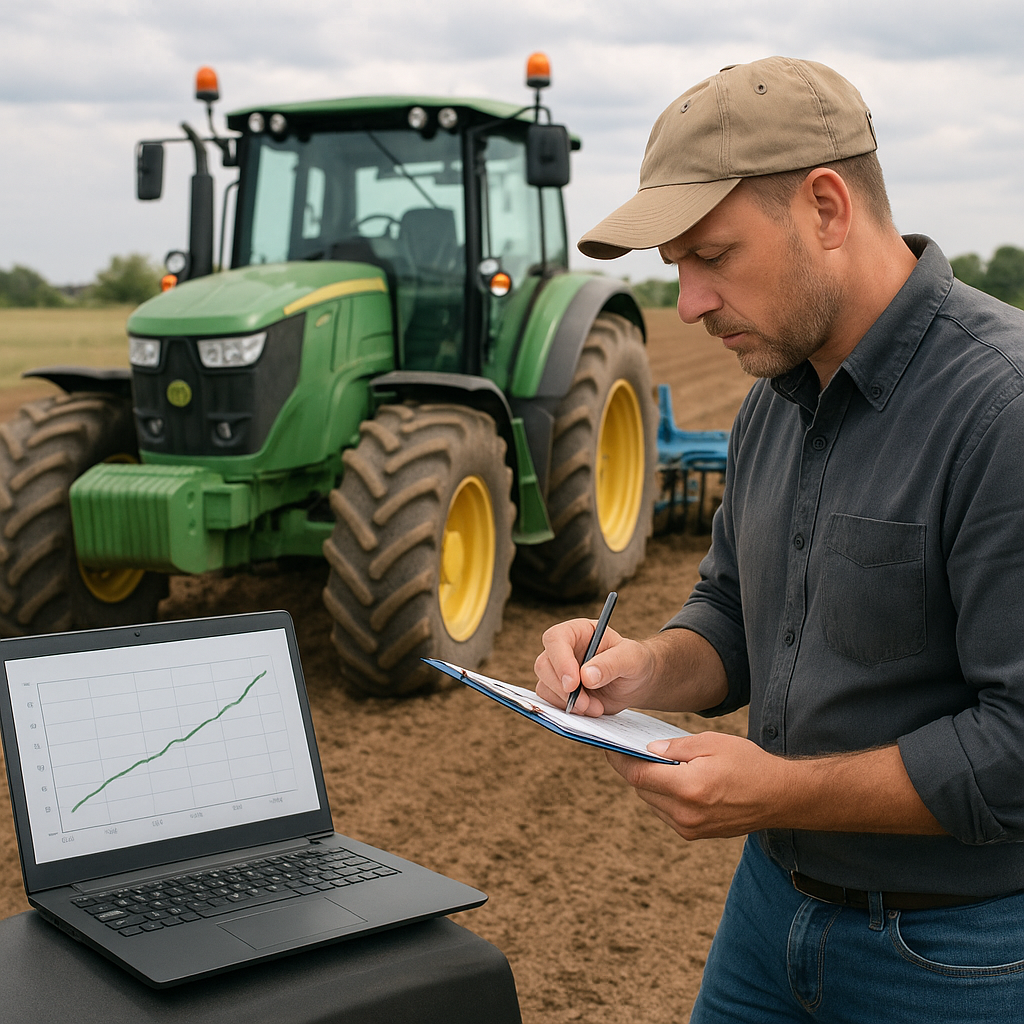
Scheduled Service and Wear Analysis
Using diagnostics from the onboard ECU, technicians can:
- Track oil change intervals and filter replacements
- Monitor hydraulic fluid condition
- Detect early signs of component wear
Resale Value and Depreciation
Performance records and maintenance logs boost resale prices. Buyers often pay premiums for machines with documented service history and minimal unscheduled repairs.
Comparing total operating costs—including depreciation, fuel, labor, and parts—provides a realistic picture of long-term tractor performance and return on investment.